
Probability is one of those fascinating concepts where it seems easy at first but gets confusing when more is revealed. The reason why I feel the need to write about this is because the interpretation of probability is becoming more mainstream as access to data increases. As a result, the internet has become more partisan with members from both sides of the political debate grabbing one-dimensional statistics, building models with these, and proposing change. This is also occurring in the workplace. Now I’m not one of those people that believes that only a few educated elites in math orientated subjects should be the only ones commenting on statistics and situations. Context and background knowledge are also an important thing. However, I’m not going to give the layperson in math a free ride. Hey, I get it. There are other important things out there to learn apart from math. So here’s a brief whistle stop tour of what you should be aware of when thinking about probability.
The main misconception is that probability is linear. What do I mean by this? To understand linearity, let us look at the following graphs:

If we are given coordinates for a point in graph A, and the number it increases by each step, we can simply keep adding steps, and we will be able to get it right (be on the line) every time. However, if we did that in graph B, we would get it right for a short range, but before long, we would be getting things wrong.
How does this translate to probability? We can apply this to rolling dice. If we roll one die, the chances of getting a 6 are 1 in 6. If we roll two, we are doubling the number of dies, so it makes sense to double the probability (adding probabilities) which gives a 2 in 6 chance of getting a 6. This seems correct, but when we roll 6 dies….. that means we get a 100% chance of getting a 6 as it’s 6 in 6. When we roll 7 dies it’s over 100% which is just plain wrong. Here we see that probability is not linear. It’s not important for this post but if you’re curious, it’s one minus the probability of it not happening to the power of the number of attempts. What is important is the attempt number to gain trade-off. I coded a loop calculating number of attempts when there’s a 20% prevalence of something. This is important:
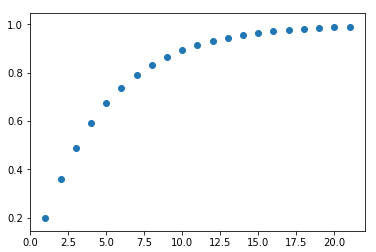
The x-axis is the number of attempts and the y-axis is the probability. What you see is that you get good gains with every attempt at the start. But as we get higher, we have to employ a lot more attempts to get small gains in probability. This is why medicine is calculated to a 95% confidence whilst physics is calculated over a 99% confidence. Adding an extra couple of million collisions in a particle accelerator to get the extra 4% probability is much more practical than enrolling an extra couple of million patients into a study and following them up.
Keeping a visual of this plot in the back of your mind is a good idea. I’ve met many educated people think of probability as a linear model, which leads to them being frustrated at the amount of effort needed to turn that 95% accuracy into a 97% accuracy when they had good returns initially. When filtering, monitoring, or analyzing a variable starts to get near the 90% accuracy, best to look for another uncorrelated variable to keep those good returns rolling. Focusing and refining one particular avenue, again and again, will eventually lead to a bad effort to reward ratio. This is why machine learning and big data are the new hot things. Machine learning regresses multiple variables at the same time, and big data allows access and analysis to many different variables. One simple but effective rule is that you’ll get good returns for the improvement of accuracy when including multiple uncorrelated variables.
